I already knew the basics.
I'd read about what happens when the grid goes down. I'd tested my own home setup and found the gaps.
But there was still one thing I didn't know.
How bad is it specifically for where I live?
Not a generic answer. Not a national average.
MY neighborhood. MY infrastructure. MY risks.
This wasn't just a general test — it showed me how a real grid down scenario would unfold in my exact location.
That's when I tried the Grid Down Simulator.
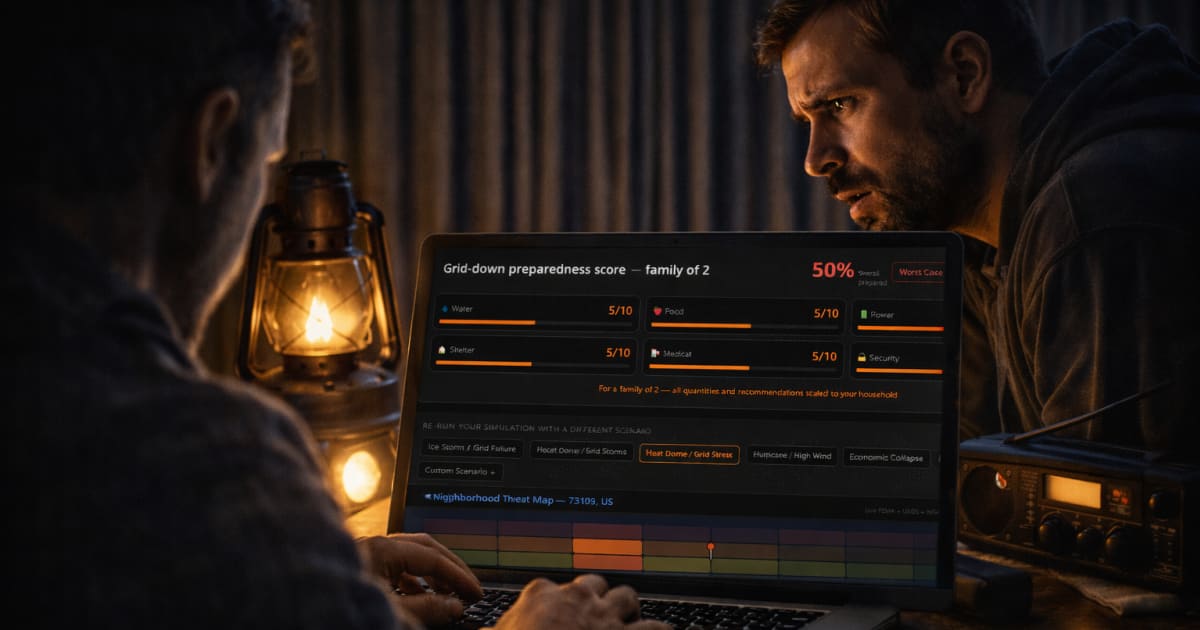
What the Grid Down Simulator Actually Does
It's not a quiz. It's not a checklist.
You enter your ZIP code. It analyzes your specific location — your geography, your regional infrastructure, your local weather history — and generates a personalized grid-down scenario just for you.
It shows you what would actually happen in YOUR area, not some generic national scenario.
I'd spent time reading about the nationwide picture.
This was different. This was personal.
Most people assume their situation is average.
It's not.
Run your ZIP code and see your real scenario
What I Entered — And How Fast It Worked
Just my ZIP code.
That's it. No account. No signup. No long form to fill out.
Within seconds, it pulled up a full report — broken into sections I didn't expect to be as detailed as they were.
Section 1: Geographic Risks
The first thing it showed me was my geographic profile.
Urban density. Proximity to major roads and highways. Terrain. Distance from natural water sources.
I knew I lived in a suburb. I didn't think much about what that actually meant in a crisis.
Turns out suburban density creates a specific set of problems — fast resource depletion, high competition for supplies, and evacuation bottlenecks I hadn't considered.

Section 2: Infrastructure Risks
This one hit different.
The simulator broke down exactly how my local infrastructure is connected — and how fast it fails when power goes out.
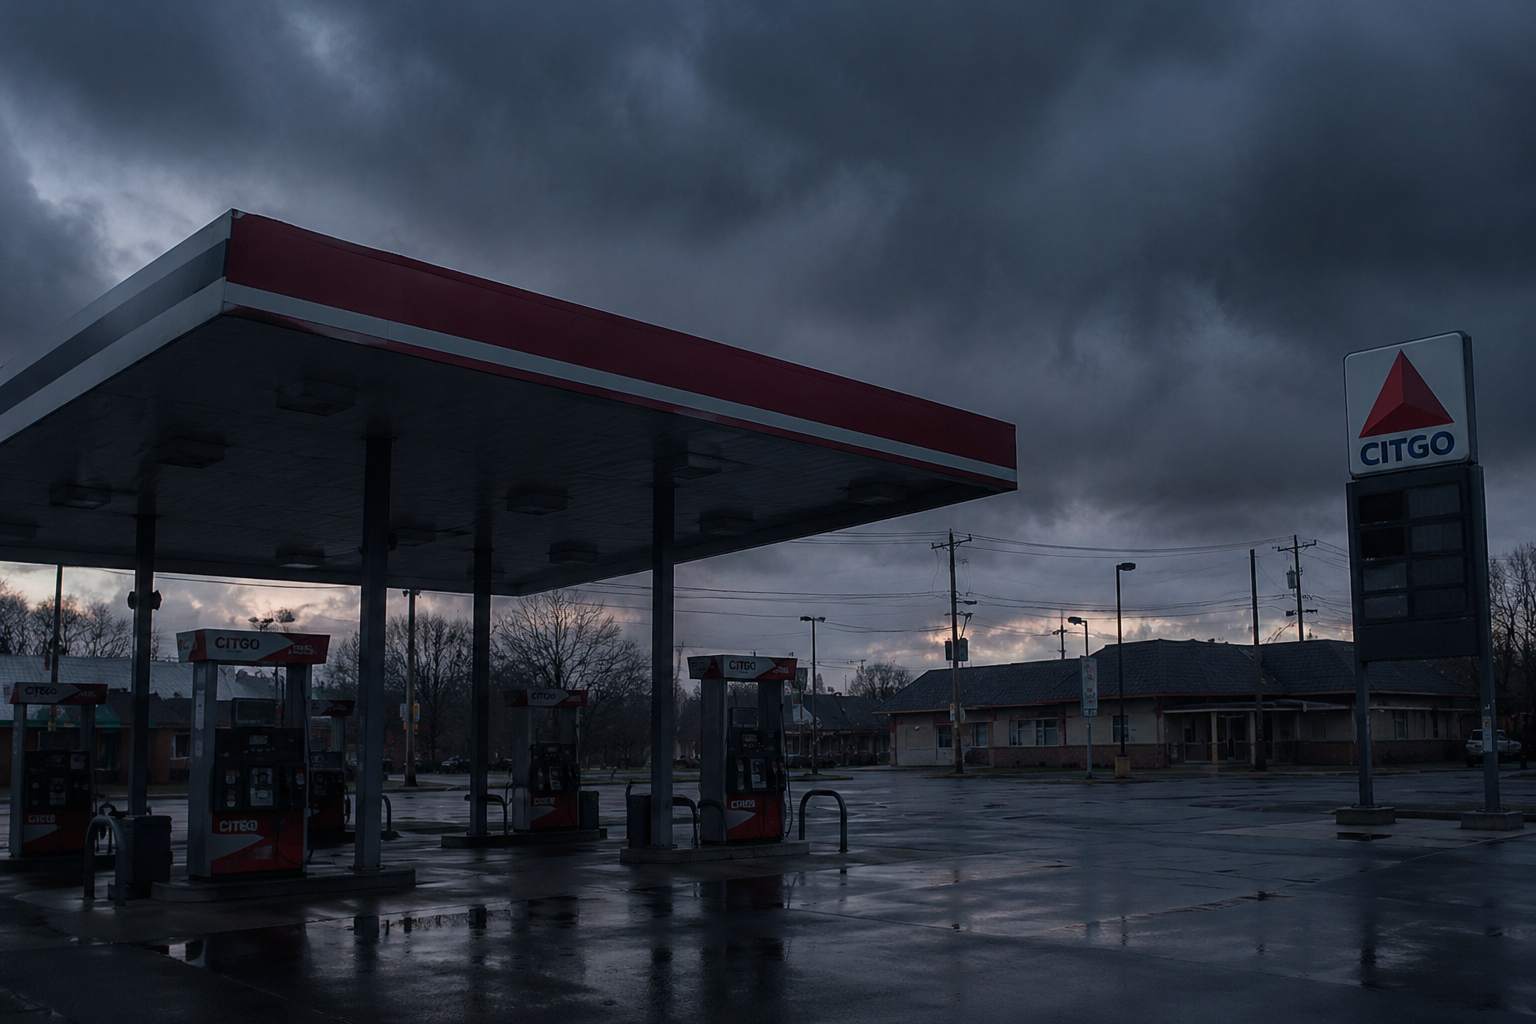
Municipal water relies on electric pumps. No power means no water pressure within 24 to 48 hours. Cell towers run on backup batteries that last 2 to 3 days. Gas stations go offline immediately.
I knew these things in theory.
Seeing them mapped to MY specific area made it real.
Section 3: Likely Water Sources Near Me
I didn't know there was a creek 1.2 miles from my house.
The simulator found it.
It also flagged that municipal water — my primary source — fails within the first 48 hours of a grid-down event. That creek becomes my backup. But only if I have the right gear to filter it.
Without a filter, it's useless.
Section 4: The Day-by-Day Timeline for My Location
This is the section that changes how you think.
Not a generic Day 1 to Day 30 breakdown. A specific one — based on my region's infrastructure, climate, and population density.
Day 1 to 3: The Immediate Shock
Power out. Stores filling with panic buyers within hours. Gas stations offline. Water pressure dropping.
Day 7: Reality Sets In
Most households out of food. No running water. My region's grid — according to historical outage data — averages 9 days to restore after a major event. We're not even halfway.
Day 15: Systemic Breakdown
Fuel supply chains strained. Medical supplies depleted. This is where the people who prepared are comfortable — and the people who didn't are desperate.
Seeing it broken down like this made one thing clear.
I wasn't just unprepared — I was unprepared for MY situation.

The Part That Surprised Me Most
I expected to feel more prepared than I was.
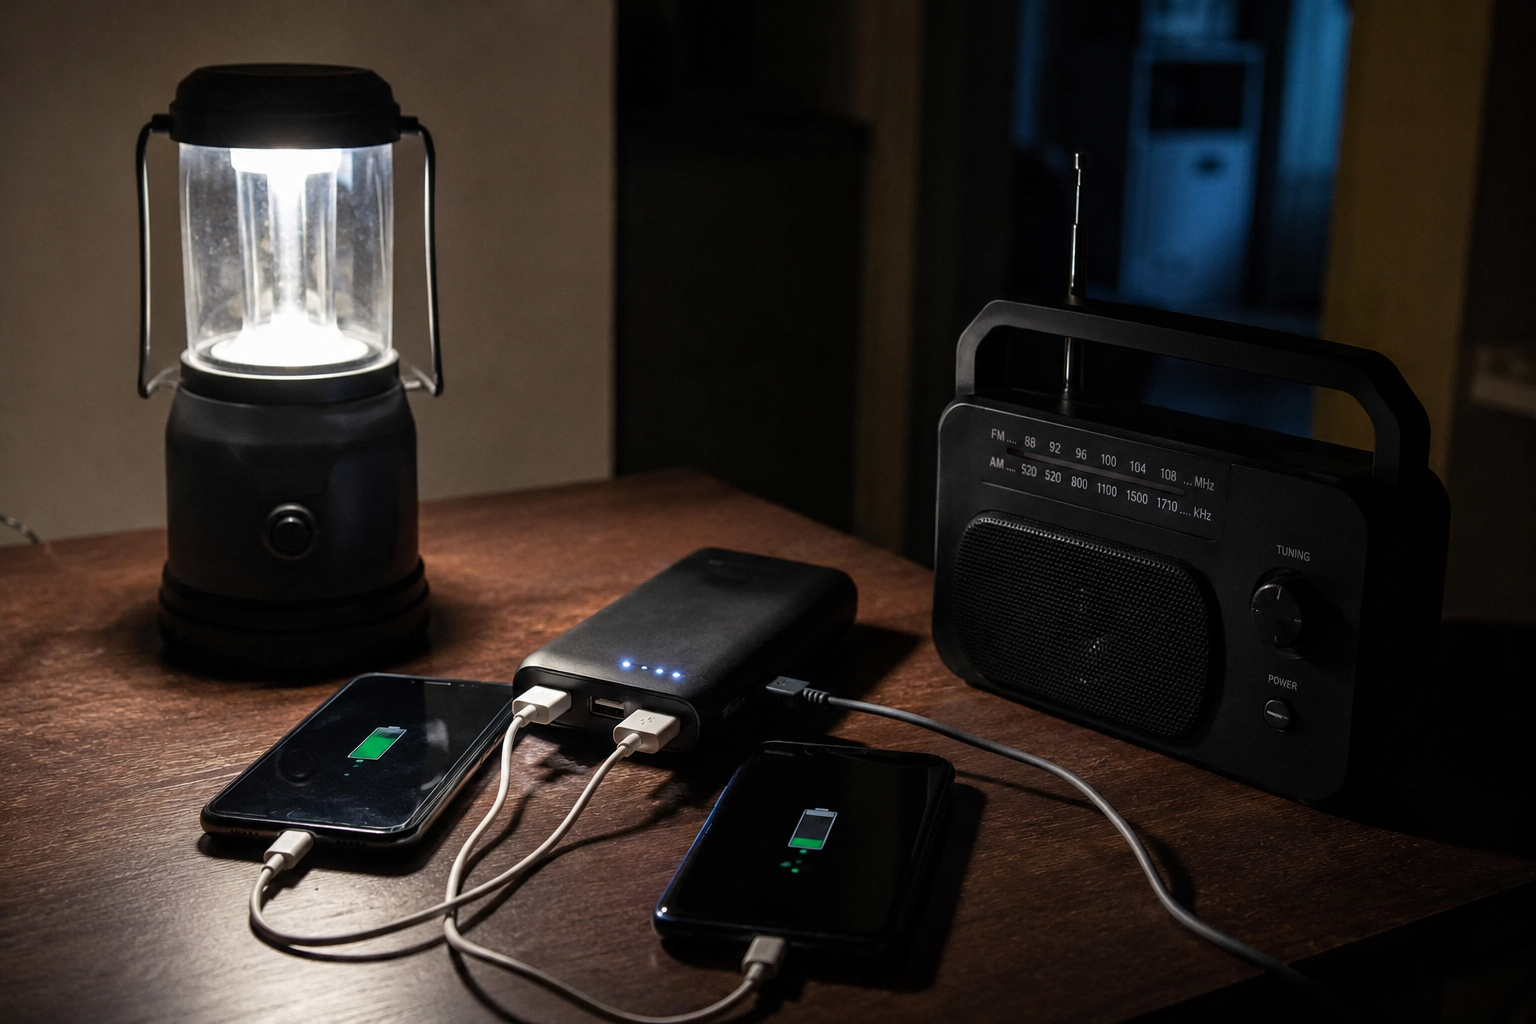
I had water. I had food. I had a power bank.
But the simulator showed me something I hadn't thought about — my specific region is in a high-risk zone for extended winter outages. Ice storms. Frozen pipes. No heat.
I had zero cold weather backup.
That's not a generic gap. That's a gap specific to where I live.
The simulator found it in seconds. I'd been missing it for years.
Read: What Happens If the Power Grid Goes Down?
The 3 Things I Changed After Seeing My Results
- Added a water filter rated for surface water.
The creek nearby is useless without one.
- Added cold weather gear.
Sleeping bags rated for below freezing. Hand warmers. Thermal layers.
- Extended my food supply from 3 days to 2 weeks.

My region averages 9-day outages. 3 days wasn't even close.
Why Your Location Changes Everything
The person in Miami and the person in Minneapolis face completely different grid-down scenarios.
Miami — hurricanes, flooding, heat, no heating gear needed.
Minneapolis — blizzards, frozen pipes, extended outages, heating is life or death.
Generic preparedness advice treats them the same.
The simulator doesn't.
FEMA National Risk Index — Official Risk Data by County
Most people prepare based on general advice.
But your situation isn't general.
See what actually applies to you
What Happens If the Power Grid Goes Down? A Step-by-Step Survival Timeline
I Tested My Home in a Grid-Down Scenario — Here's What Happened